Application of the Event Model in Soccer
This section demonstrates applications of the Event Model in soccer.
Heat Map of the Predicted Next Event Location (Gaussian Smoothed)
The following code snippet shows how to use the Event_Model class to plot a heat map of the next event location based on model predictions.
from event import Event_Model
import pandas as pd
import os

# Initialize the LEM model
model = Event_Model('LEM', 'path/to/LEM.yaml')

# Set paths for inference data and min-max scaling dictionary
inference_data_path = 'path/to/inference.csv'
min_max_dict_path = 'path/to/min_max_dict.json'
save_path_folder = 'path/to/save'

# Ensure the save path directory exists
os.makedirs(save_path_folder, exist_ok=True)

# Define the row in the inference data to visualize
row_num = 100

# Plot the heat map
model.plot_heat_map(inference_data_path, min_max_dict_path, save_path_folder, row_num)
The generated heat map will show the predicted next event location based on model inference.
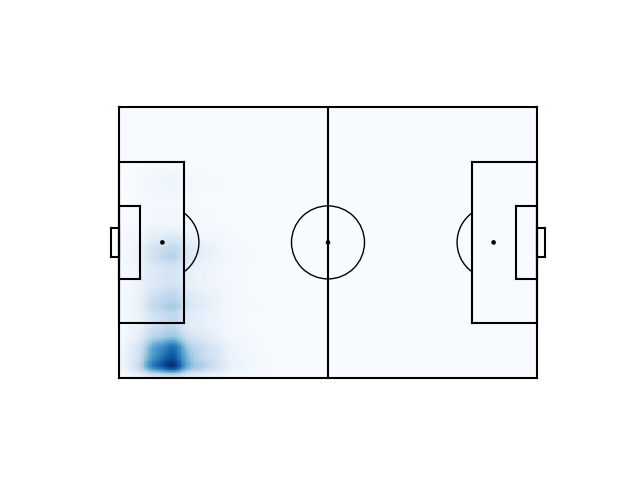
This visualization helps identify potential areas for the next event, making it easier to analyze patterns and trends in soccer gameplay.
Holistic Possession Utilization Score (HPUS) and HPUS+
The following code snippet demonstrates how to use the Event_Model class to plot the HPUS score for each 5-minute segment of a match. For a detailed explanation of HPUS and HPUS+, including their formulas, please refer to the NMSTPP model paper.
from event import Event_Model
import os
import pandas as pd

# Initialize the LEM model
model = Event_Model('LEM', 'path/to/LEM.yaml')

# Define paths for inference data and min-max scaling dictionary
inference_data_path = 'path/to/inference.csv'
min_max_dict_path = 'path/to/min_max_dict.json'
save_path_folder = 'path/to/save'

# Ensure the save path directory exists
os.makedirs(save_path_folder, exist_ok=True)

# Load and filter data for a specific match
match_id = 3894771
df = pd.read_csv(inference_data_path)
df_match = df[df['match_id'] == match_id]

# Calculate HPUS
hpus = model.cal_HPUS(data=df_match, save_path=save_path_folder)

# Calculate HPUS+
hpus_plus = model.cal_HPUS(data=df_match, save_path=save_path_folder, plus=True)
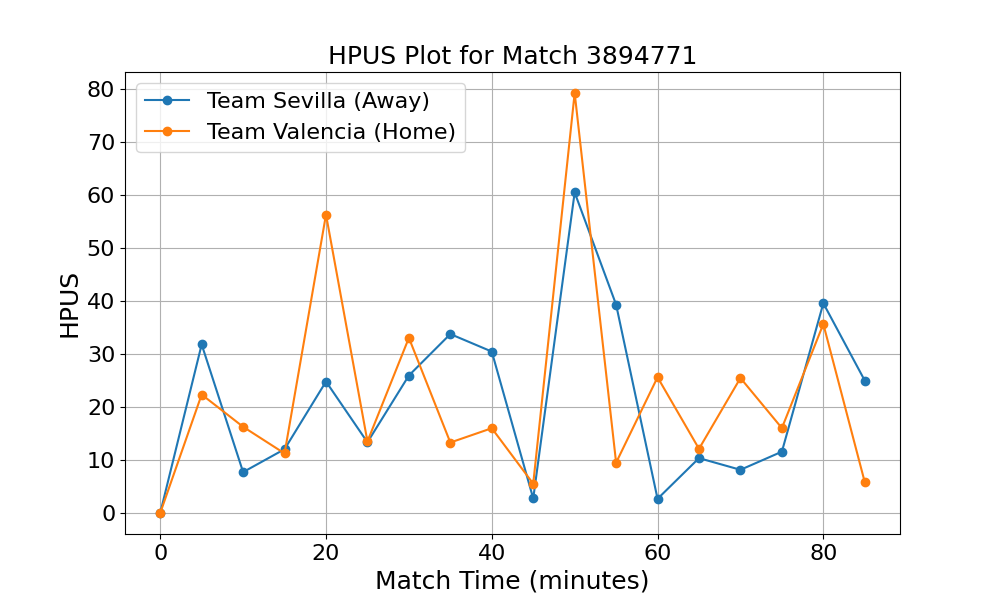
This visualization illustrates the overall value of each possession during each 5-minute interval, providing insights into team performance and strategy over the course of the match.
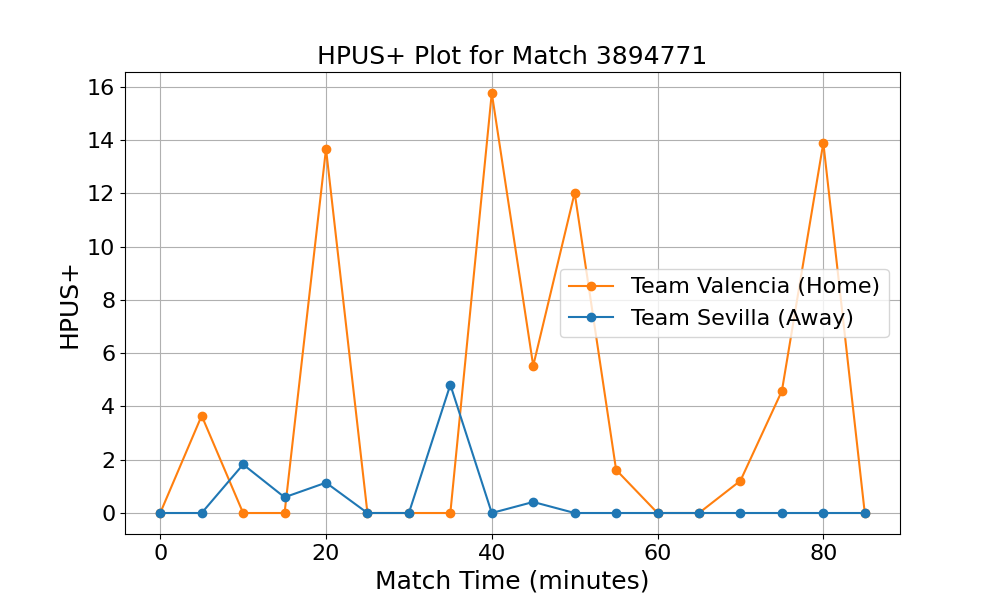
This visualization shows how effectively the team has realized possession value during each 5-minute segment, offering insights into their attacking performance and overall effectiveness.
Possession Utilization Score (Poss-Util)
The following code snippet demonstrates how to use the Event_Model class to plot the Poss-Util and Poss-Util+ metrics for each team’s performance over a specified period. For a detailed explanation of Poss-Util and Poss-Util+, including their formulas, please refer to the Seq2Event model paper.
from event import Event_Model
import os
import pandas as pd

# Initialize the LEM model
model = Event_Model('LEM', 'path/to/LEM.yaml')

# Define paths for inference data and min-max scaling dictionary
inference_data_path = 'path/to/inference.csv'
min_max_dict_path = 'path/to/min_max_dict.json'
save_path_folder = 'path/to/save'

# Ensure the save path directory exists
os.makedirs(save_path_folder, exist_ok=True)

# Define specific teams to calculate Poss-Util, or leave empty to calculate for all teams
teams = ['Real Madrid', 'Athletic Club', 'Deportivo Alavés', 'Mallorca', 'Granada']
poss_util = model.cal_poss_util(data=inference_data_path, save_path=save_path_folder, team=teams)

This visualization illustrates the overall possession value performance of each team over a given period, offering insights into possession effectiveness and team strategy.

This visualization illustrates the attacking performance of each team over the period, highlighting their success in maximizing possession value.