Application of the RLearn Model in Soccer
This section demonstrates applications of the RLearn Model in soccer.
Q-values and Location Visualization
The following code snippet shows how to visualize the Q-values for the trained RLearn model.
from .soccer.main_class_soccer.main import rlearn_model_soccer
import os

# Set path and experiment name for visualize data
model_name = 'exp_config'
checkpoint_path = os.getcwd()+'/rlearn/sports/output/sarsa_attacker/test/checkpoints/epoch=1-step=2.ckpt'

# Visualize
RLearn_Model().visualize_data(
    model_name=model_name,
    checkpoint_path=checkpoint_path,
    match_id='2022100106',
    sequence_id=0,
)
The generated image will show the predicted Q-values based on reinforcement learning.
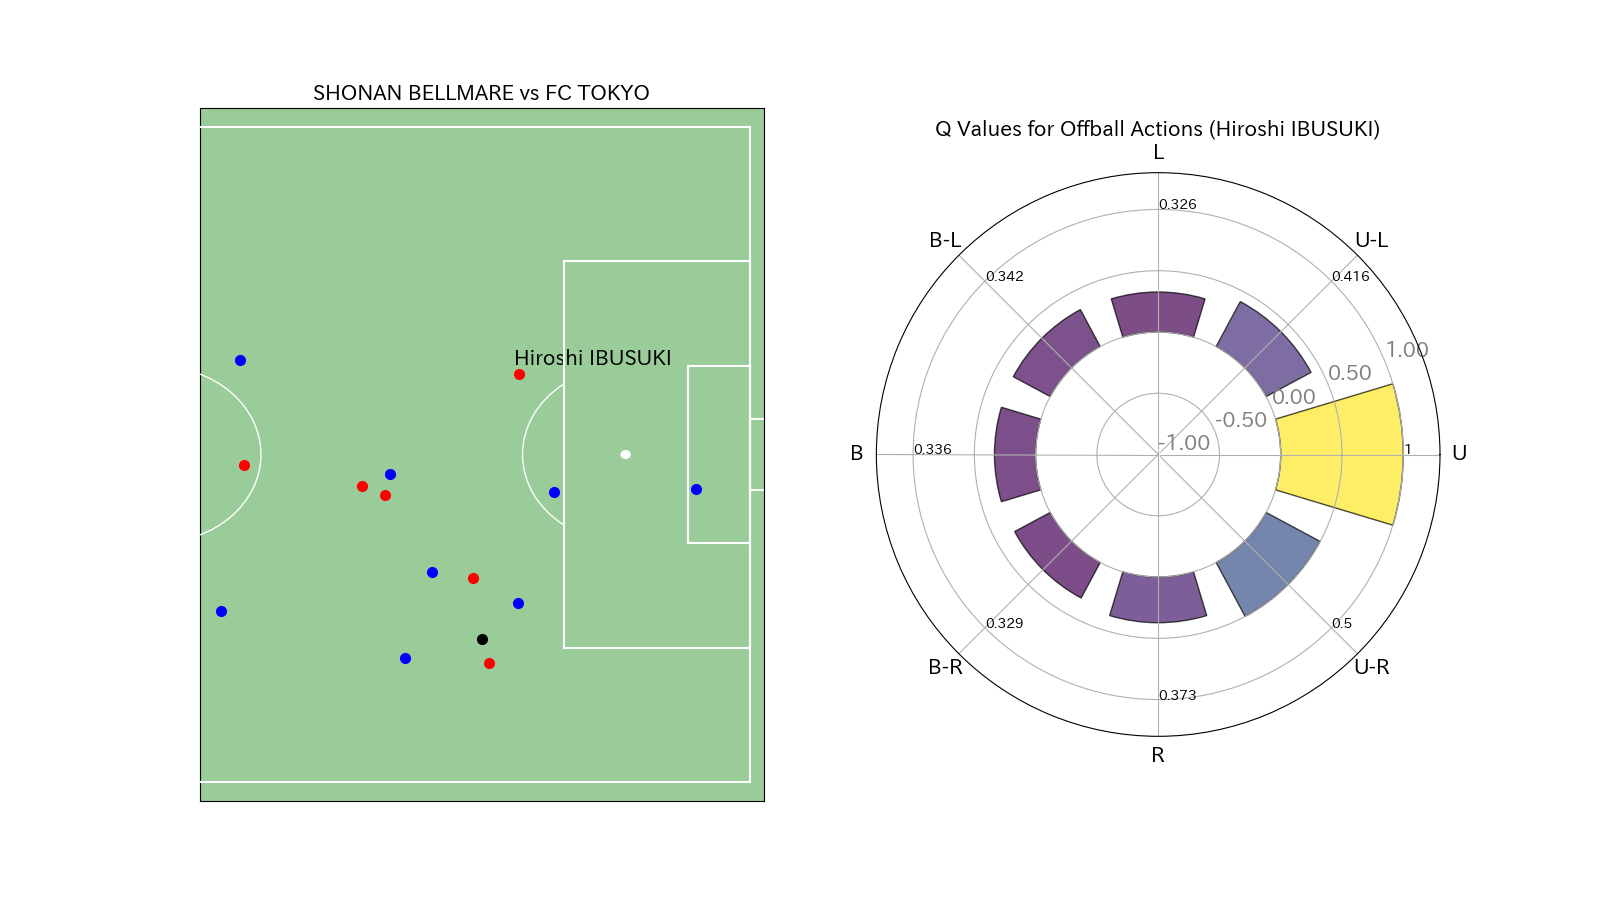
This visualization helps identify potential areas for the next event, making it easier to analyze patterns and trends in soccer gameplay.